Understand and visualize data easily
The Gamma makes it extremely easy to summarize data and create useful tables and nice visualizations. Thanks to the built-in pivot type provider, the language understands your data source and exposes all operations in an easy to discover way. Just type dot and see what columns and operations on them are available!
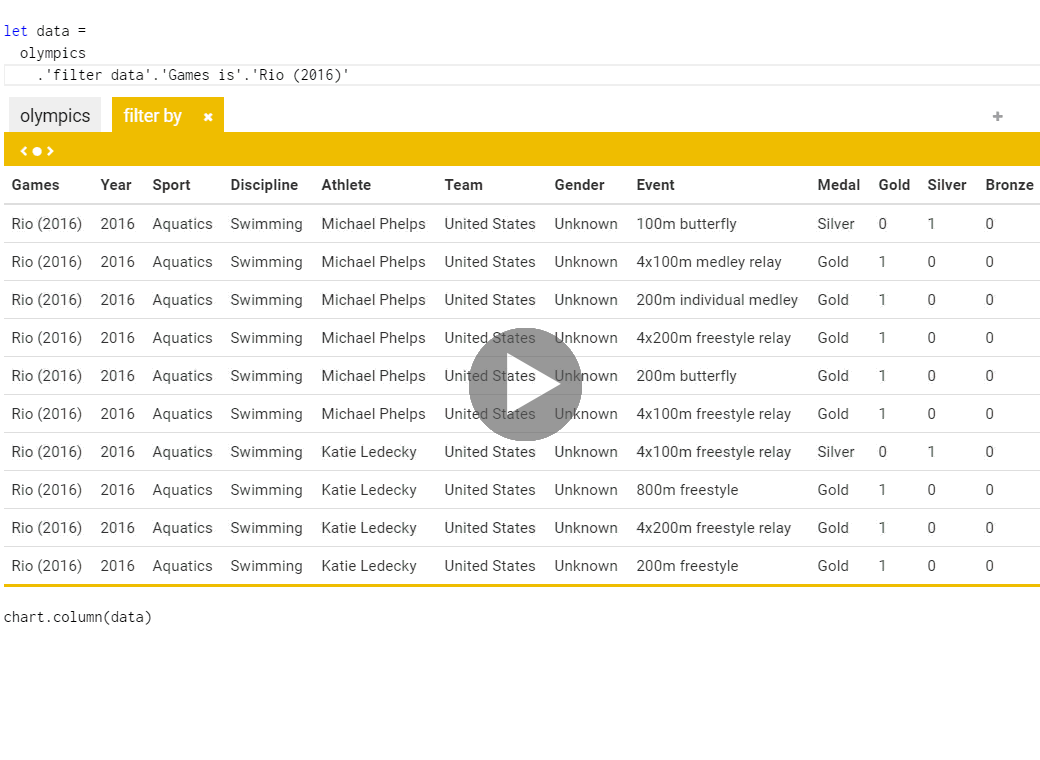
olympics
  .'filter data'.'Games is'.'Rio (2016)'.then
  .'group data'.'by Athlete'.'sum Gold'.then
  .'sort data'.'by Gold descending'.then
  .'paging'.take(8)
  .'get series'.'with key Athlete'.'and value Gold'
This example calculates the top 8 medalists from Rio 2016 Olympic games, sorted by the total number of gold medals. You can understand the code even without programming experience - we filter all Olympic medals to cover only Rio, then we sum gold medals per athlete, take the top 8 and return a data series that maps athlete name to number of gold medals they won.
With The Gamma, you can edit the code by hand with modern tooling that offers available members when you type dot, but you can also use live editor that shows the results instantly and lets you modify the code from a simple user interface. Try it below!
Visualizing Olympic medals
If you want to see The Gamma in action, check out the visualizations of Olympic medalists, which was created using early version of the project. See also blog post documenting some of its features.
Click below to view and edit the code in our innovative editor with live previews! Can you change it to see medals for London 2012?
Best of programming and spreadsheets
Almost anyone can use a spreadsheet to perform basic data analysis and create a chart, but doing the same in a transparent and more flexible way using a programming language has always been a task for experts. What would an environment somewhere between spreadsheet tools and programming language look like?
When exploring data in The Gamma, you can always see the data you're working with just like when manipulating data using a spreadsheet. You can write the code to transform data using a modern, powerful editor with autocomplete that understands the data source and suggests what operations and columns are available.
You do not always need to write code. For many common operations such as grouping, sorting and filtering data, the live preview lets you add and configure data transformations in a simple user interface. However, the code is always visible and so anyone can understand your data analysis and reproduce it.
Extensible and simple JavaScript library
The Gamma is available on npm and you can use it as any other JavaScript component. It provides a simple and extensible API that lets you specify data sources available in the programming environment, create rich editor for your users and run scripts written using The Gamma. The library is open-source, hosted on GitHub and available under the permissive MIT license. If you have some suggestion, please open an issue!
When using The Gamma, you need to specify data sources like the olympics
value used in the above demos. This is done by defining one or more type providers that
are available in the program environment - those are created as simple REST services,
as documented in publishing data, and specified in The Gamma
API as follows (using example.com):
// Specify data source and available libraries
var svc = "http://example.com/services/olympics";
var lib = "http://example.com/lib/libraries.json";

// Create type providers exposing 'olympics' data
var providers =
  g.providers.createProviders({
    "libraries": g.providers.library(lib),
    "olympics": g.providers.pivot(svc) });

// Create evaluation and checking context
var ctx = g.gamma.createContext(providers);
You can find the full documentation for the JavaScript API on the
page for developers. The above example defines two type
providers. First, the pivot type provider, which takes a data source and lets the user
perform aggregation over the data. This is what you can see in the above GIF and
play with in the Olympic medalists demo. The second provider exposes JavaScript libraries,
using metadata specified in a json file. This defines the chart
and table types used in the demo.
The following code snippet illustrates some of the operations that you can do once you create program context, such as running programs and creating a source code editor:
// Run code and render output to out-elem-1
var code = "your script goes here";
ctx.evaluate(code, "out-elem-1");

// Specify options for the code editor
var opts =
  { height: 800,
    width: 1000,
    monacoOptions: function(m) {
      m.fontFamily = "Inconsolata";
      m.fontSize = 15;
  }};

// Create editor, get and set the source
var editor = ctx.createEditor("ed-elem-1", code, opts);
editor.setValue(code);
editor.getValue();
Once you create context, you can use the evaluate function to
run any script written using The Gamma (this does not even require the editor).
This is used on this page to create the chart of top Olympic medalists from
Rio 2016 that you can see above. The createEditor function is
then used when you click on the "Edit source code" button.
As you can see, thanks to The Gamma, creating an open and transparent environment that encourages readers to explore data on their own is just a matter of writing a couple of simple lines of code!
Getting started with The Gamma
- Exploring data: Learn more about The Gamma script and the code you can write to transform data in our editor. This is a non-programmer guide to using The Gamma.
- For developers: Learn how to use our JavaScript package and about the functionality it currently exposes. For discussion and issues, follow the project on GitHub.
- Publishing data: Create a service that exposes data for the pivot type provider. The service needs to provide a single end-point that can return the data and evaluate simple aggregations.
- Contributing: If you are a developer and want to help us, this is the place to start. The Gamma is written using the awesome F# language and compiled to JavaScript using Fable, so this is fun project if you want to play with some nice technology!